


Executive Summary
Harvard University partnered with Onetree to design and implement India Policy Insights, an award-winning geospatial data visualization platform built to support evidence-based health and population policy decisions at scale.
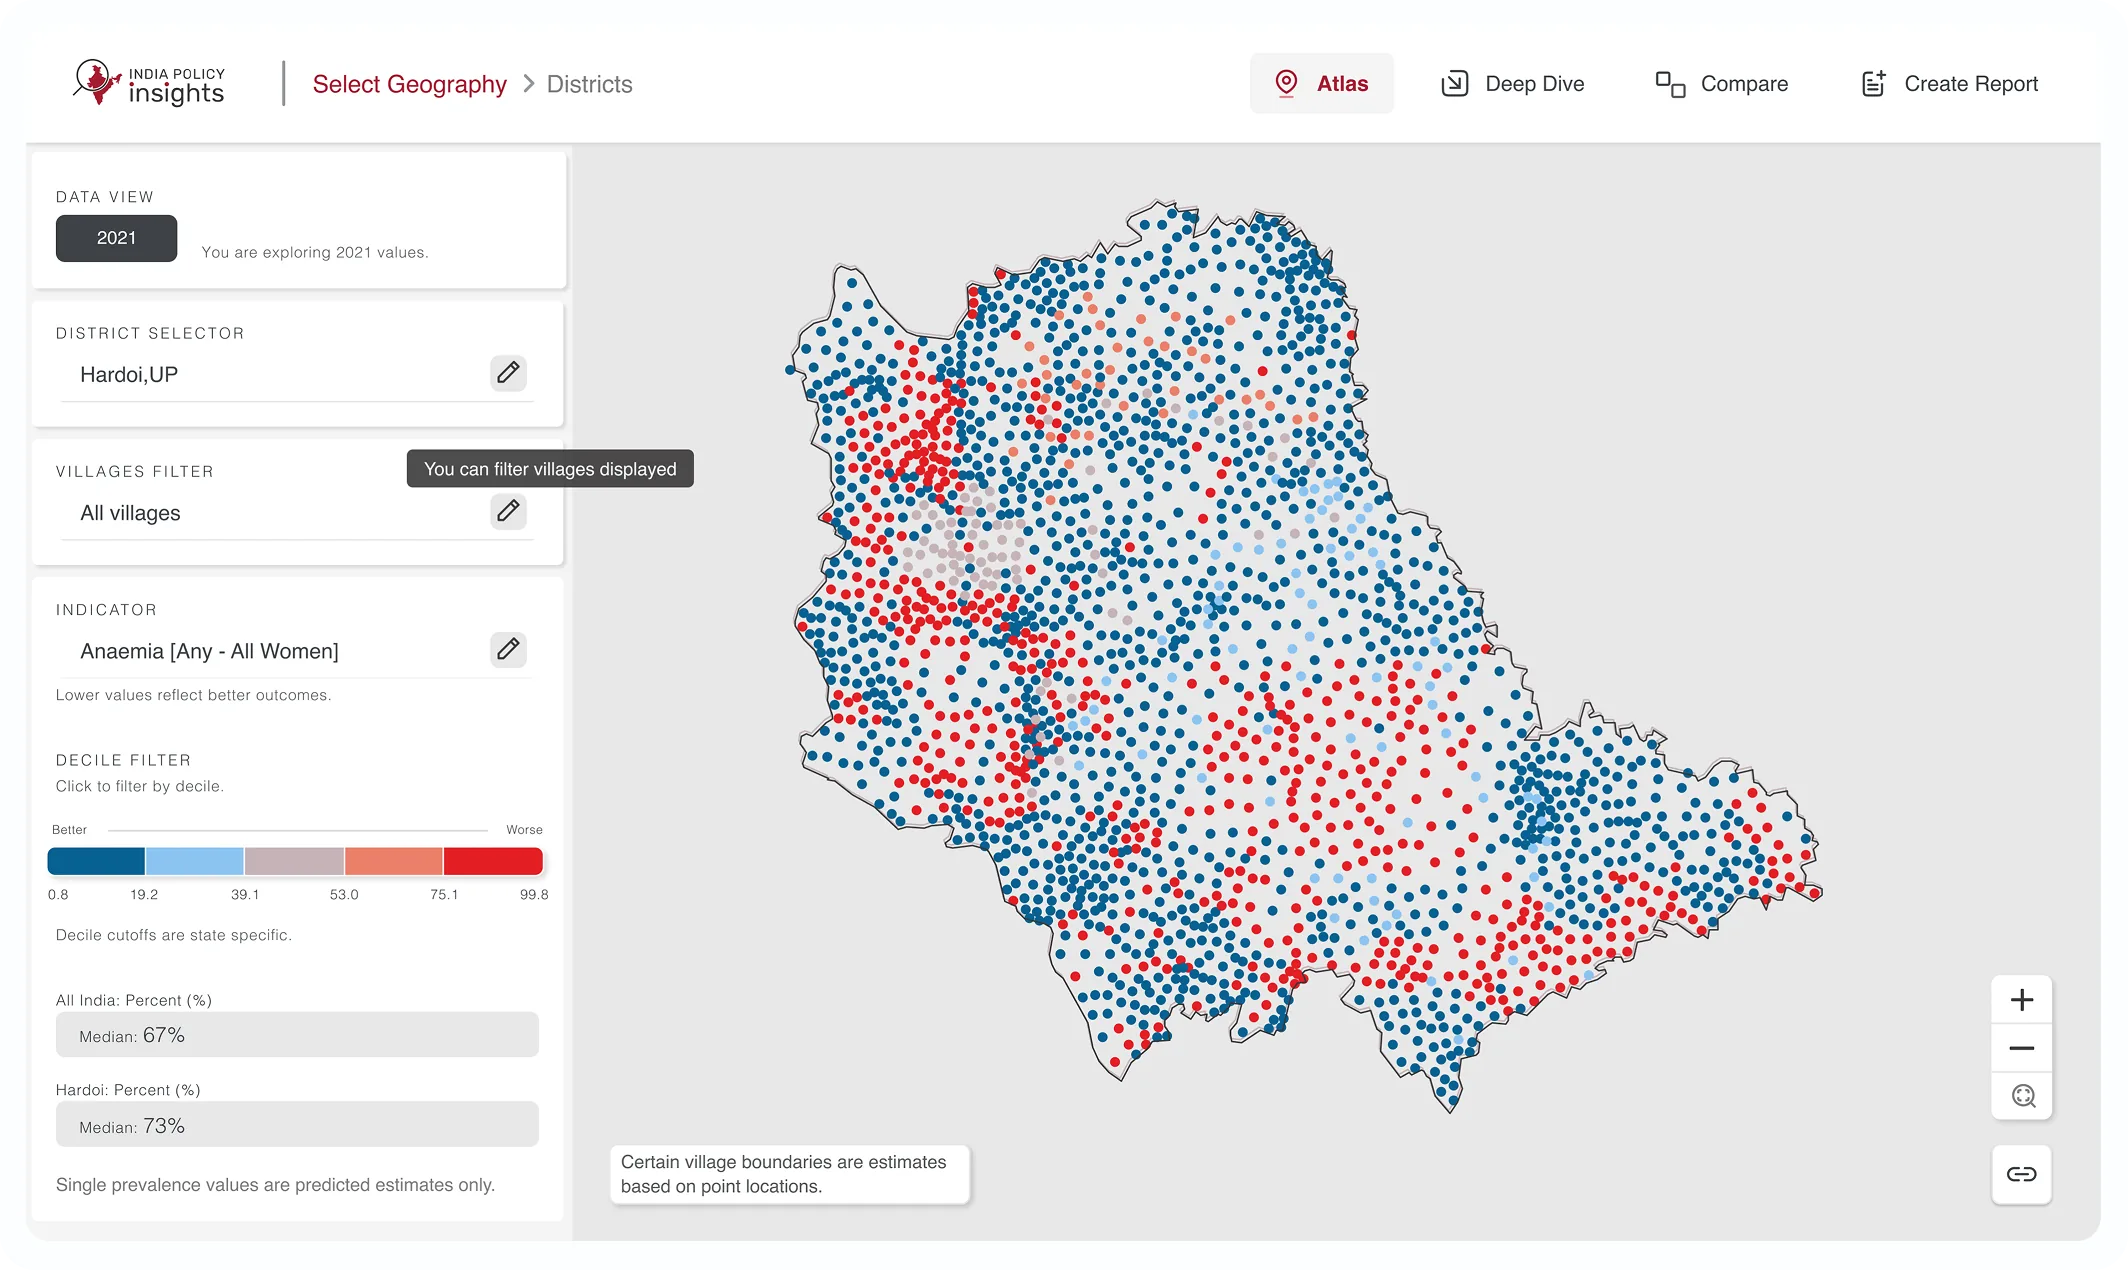
The platform addresses a core challenge in public policy: transforming high-volume, high-granularity geospatial data into clear, comparable, and decision-ready insights. Built with a .NET backend and PostgreSQL, and a React-based frontend, India Policy Insights enables policymakers, researchers, and journalists to explore and visualize complex datasets across multiple administrative levels without relying on traditional GIS tools.
By combining user-centered design, a scalable technical architecture, and high-performance map-based visualizations, the platform significantly reduces the gap between data availability and actionable policy insights. In 2025, the project received the AAG Health Data Visualization Award, recognizing its impact, usability, and contribution to public policy analysis.

The Challenge: Making large-scale geospatial health data usable for policy decisions
Harvard University’s Geographic Insights Lab works with highly granular health, population, and socio-economic datasets that are critical for understanding regional disparities and informing public policy in India. However, the scale and complexity of the data posed a significant challenge.
The core problem was twofold:
- Data volume and performance
The platform needed to handle very large geospatial datasets, spanning hundreds of millions of geographic entities and multiple indicators, without compromising speed, reliability, or scalability. - Map-based data visualization at scale
Visualizing this volume of data on interactive maps required overcoming common limitations of traditional tools, ensuring that users could explore, filter, and compare data smoothly, without long load times or reduced usability.
Beyond the technical complexity, the challenge was also experiential. The platform had to support non-technical users, policymakers, researchers, and journalists, who needed to extract insights quickly, without relying on specialized GIS expertise.
The objective was clear: build a solution capable of processing and visualizing massive geospatial datasets while delivering an intuitive, decision-ready experience that could support evidence-based policy decisions at scale.
The Solution: A scalable, user-centered platform for geospatial policy analysis
To address the challenge of handling and visualizing large-scale geospatial data, Onetree partnered with Harvard University to design and build India Policy Insights, an interactive platform purpose-built for policy decision-making at scale.
The solution focused on three core pillars:
Scalable data architecture
India Policy Insights was designed with a robust backend built on .NET and PostgreSQL, capable of processing and querying high-volume, high-granularity datasets efficiently. This architecture ensures reliable performance even when working with hundreds of millions of geographic entities and multiple indicators simultaneously.
High-performance geospatial visualization
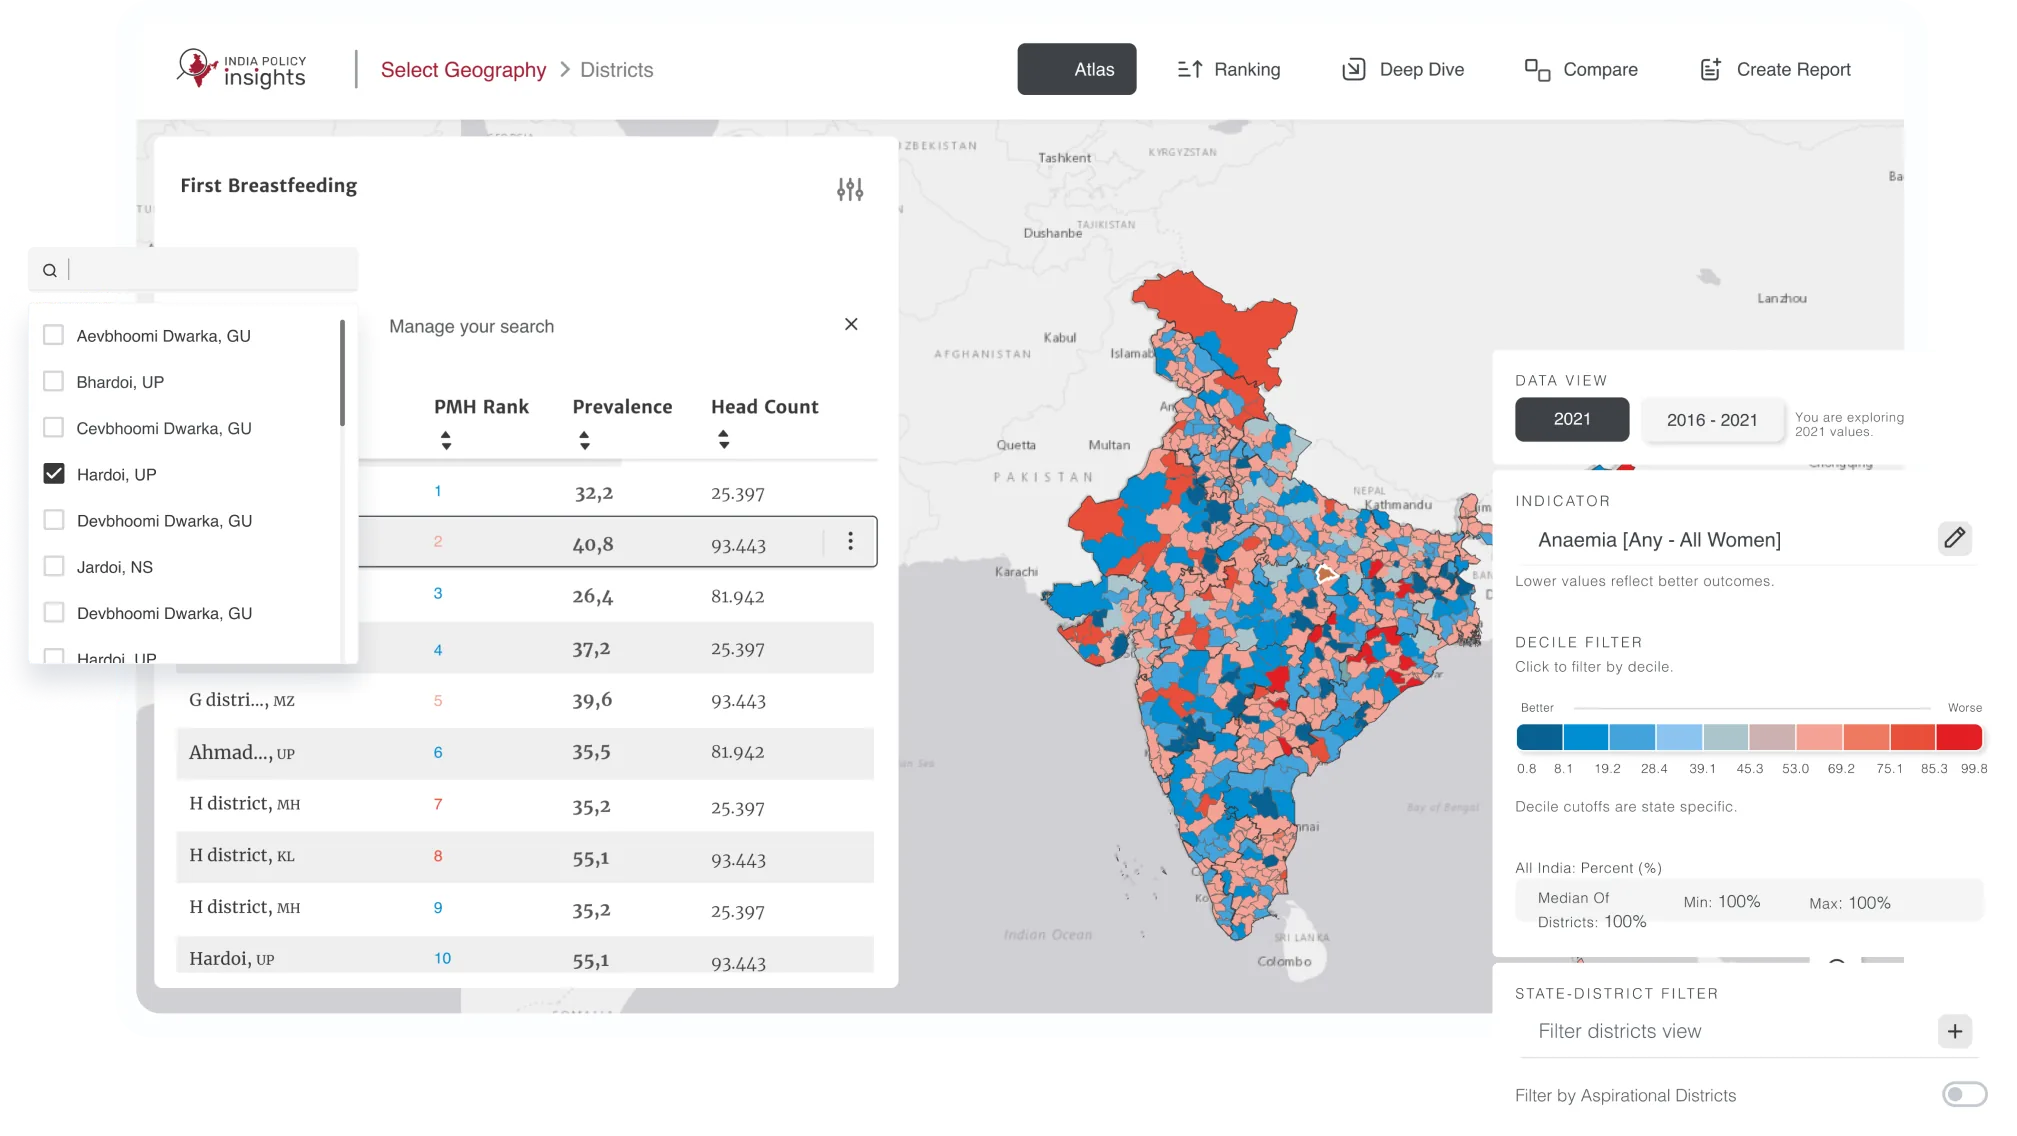
A React-based frontend enables dynamic, map-driven exploration of data, allowing users to filter, compare, and analyze indicators directly on interactive maps. Special attention was given to performance and responsiveness, ensuring smooth interactions despite the volume and complexity of the underlying data.
User-centered, decision-ready experience
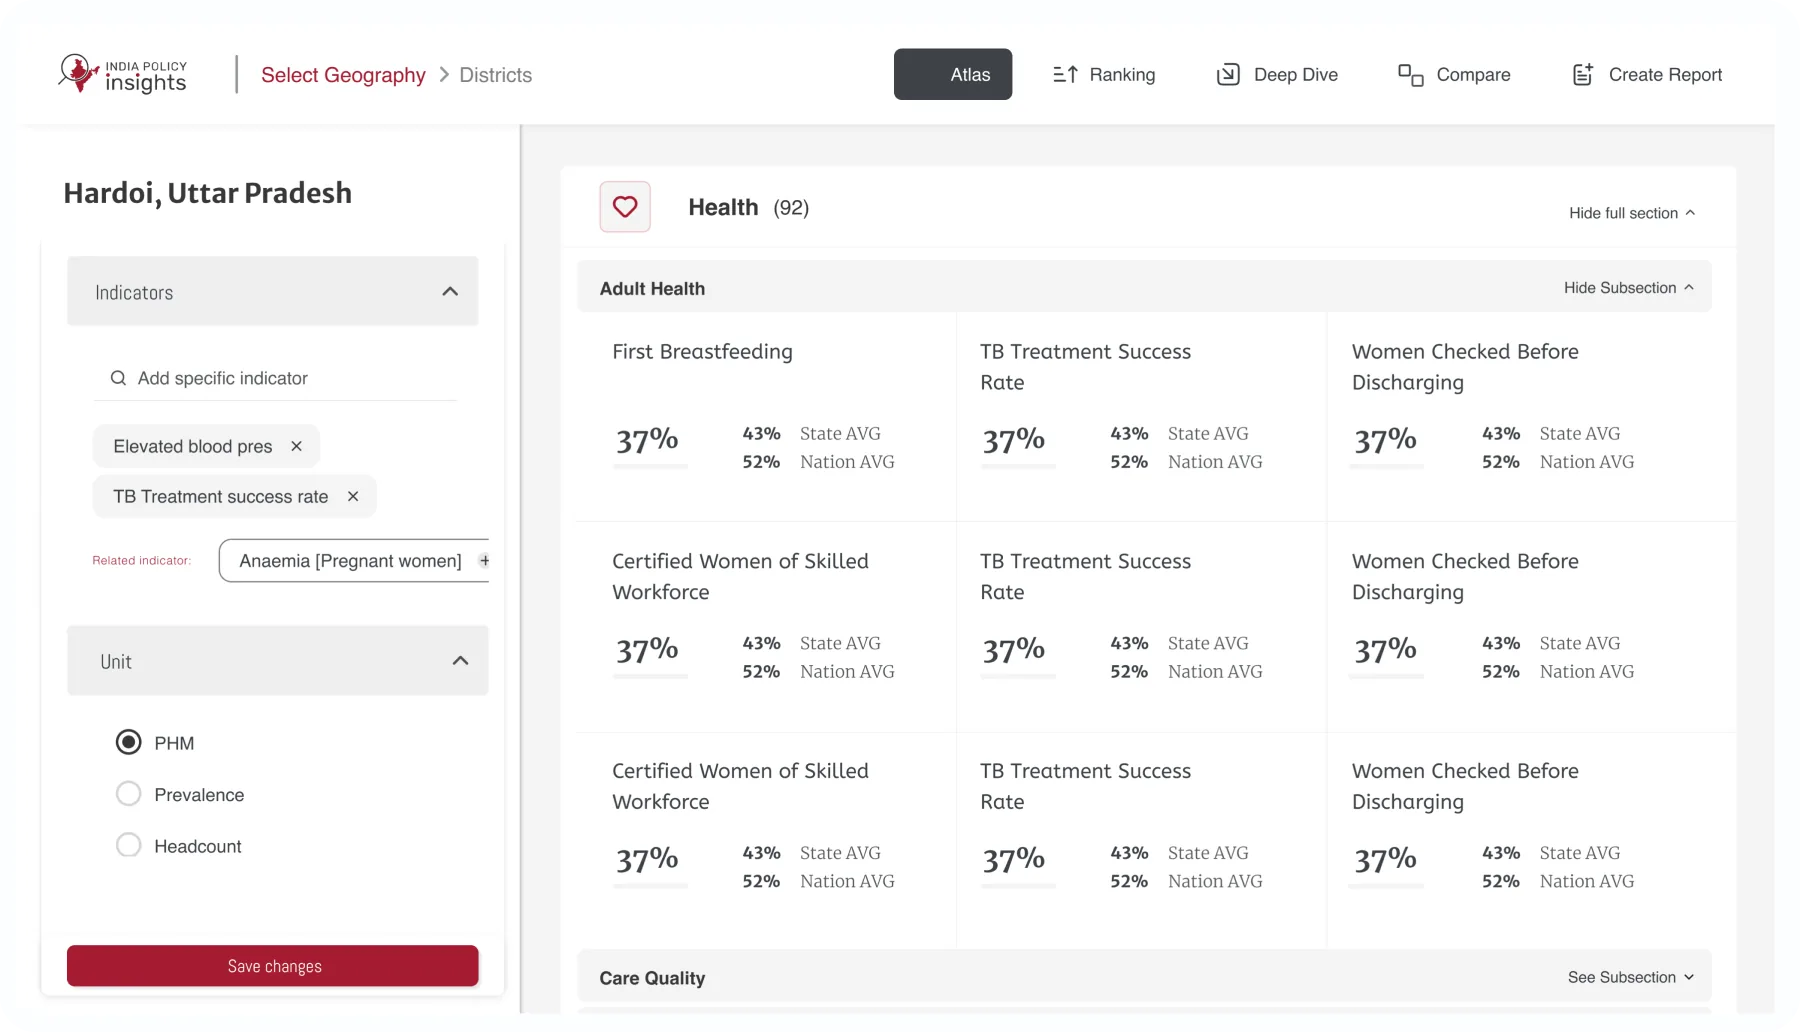
Rather than replicating traditional GIS workflows, the platform was designed to support non-technical users. Clear interaction patterns, progressive data exploration, and comparison tools help policymakers and researchers move from data exploration to insight generation without requiring specialized GIS knowledge.
By combining a scalable technical foundation with a carefully designed user experience, India Policy Insights transforms complex geospatial data into accessible, comparable, and actionable insights, enabling evidence-based health and population policy decisions at scale.
Results & Impact: Enabling confident, data-driven policy decisions at scale
India Policy Insights significantly improved the way health and population data is explored, interpreted, and used for public policy decisions in India.
By making large-scale geospatial data accessible and usable, the platform enabled:
- Faster insight generation for policy analysis
Policymakers and researchers can now explore, compare, and interpret complex datasets across multiple administrative levels without relying on specialized GIS teams. - Improved understanding of regional disparities
Interactive, map-based visualizations allow users to identify geographic patterns and disparities in health, nutrition, and socio-economic indicators, supporting more targeted and informed policy interventions. - Broader access to high-quality data
The platform democratizes access to granular data, enabling journalists, analysts, and public officials to work directly with reliable, evidence-based information.

In recognition of its impact and design quality, India Policy Insights received the 2025 Health Data Visualization Award from the American Association of Geographers (AAG), highlighting the platform’s contribution to effective public policy analysis through geospatial data visualization.